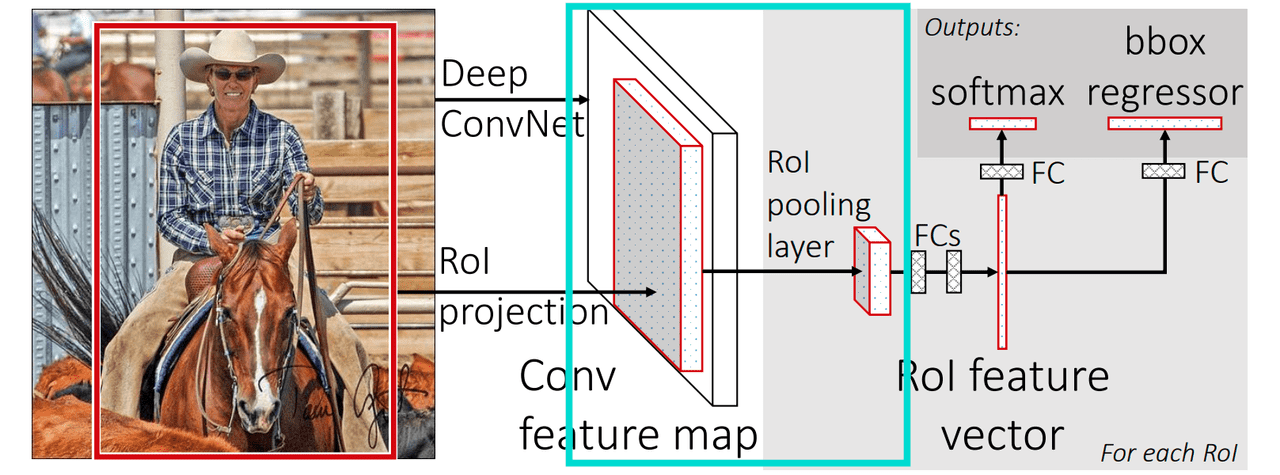
We’re going to discuss original RoI pooling described in Fast R-CNN paper (light blue rectangle on the image above). There is a second and a third version of that process called RoIAlign and RoIWarp.
If you’re interested in those two please check out Second Part of this article
What is RoI?
RoI (Region of Interest) is a proposed region from the original image. We’re not going to describe how to extract those regions because there are multiple methods to do only that. The only thing we should know right now is there are multiple regions like that and all of them should be tested at the end.
How Fast R-CNN works?
Feature extraction
Fast R-CNN is different from the basic R-CNN network. It has only one convolutional feature extraction (in our example we’re going to use VGG16).
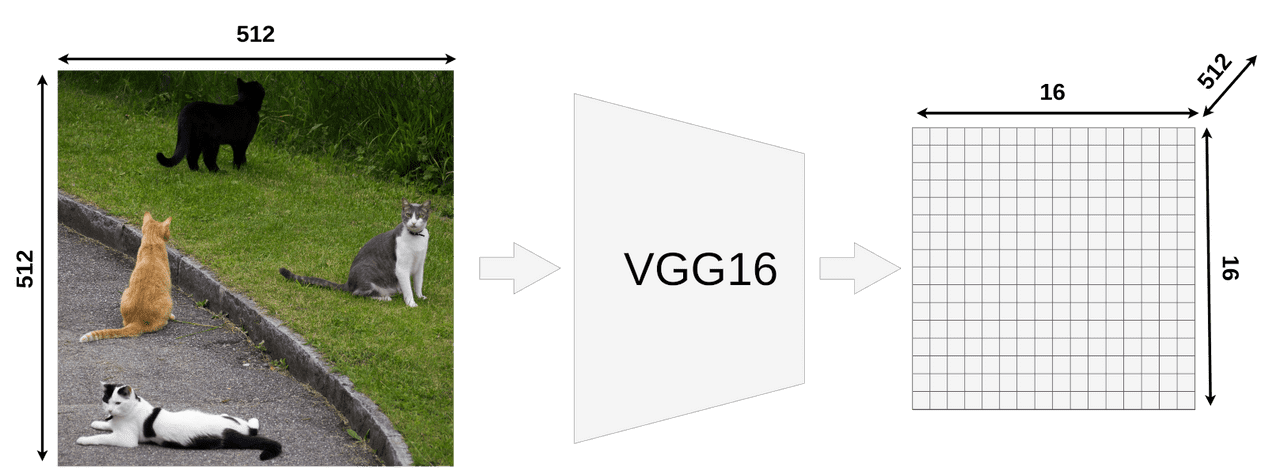
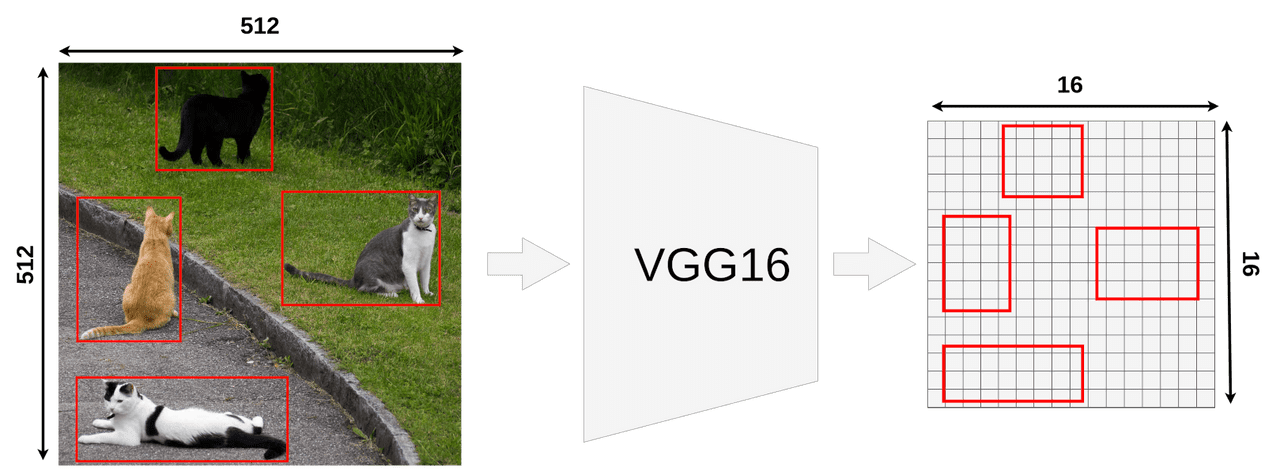
Our model takes an image input of size 512x512x3 (width x height x RGB) and VGG16 is mapping it into a 16x16x512 feature map. You could use different input sizes (usually it’s smaller, default input size for VGG16 in Keras is 224x224).
If you look at the output matrix you should notice that it’s width and height is exactly 32 times smaller than the input image (512/32 = 16). That’s important because all RoIs have to be scaled down by this factor.
Sample RoIs
Here we have 4 different RoIs. In the actual Fast R-CNN you might have thousands of them but printing all of them would make image unreadable.
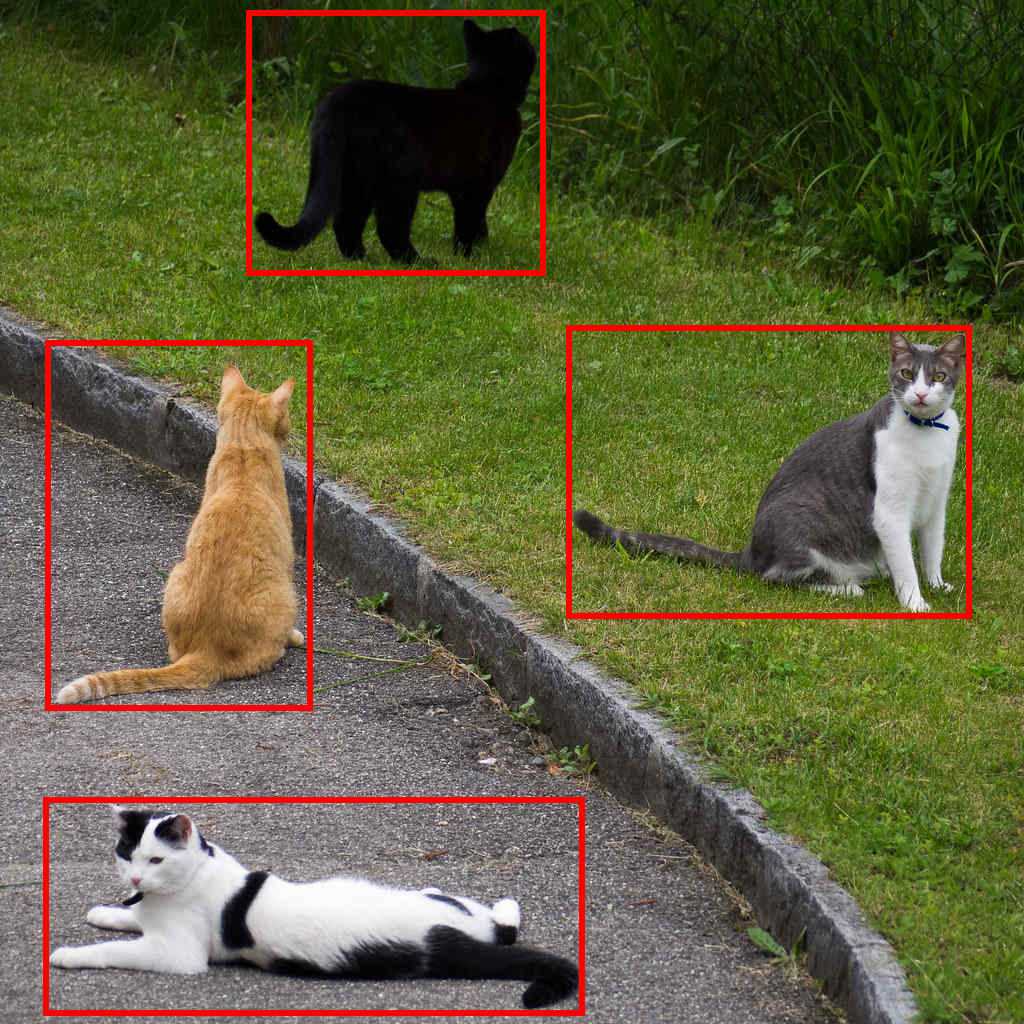
It’s important to remember that RoI is NOT a bounding box. It might look like one but it’s just a proposal for further processing. Many people are assuming that because most of the papers and blog posts are creating proposals in place of actual objects. It’s more convenient that way, I did it as well on my image. Here is an example of a different proposal area which also is going to be checked by Fast R-CNN (green box).
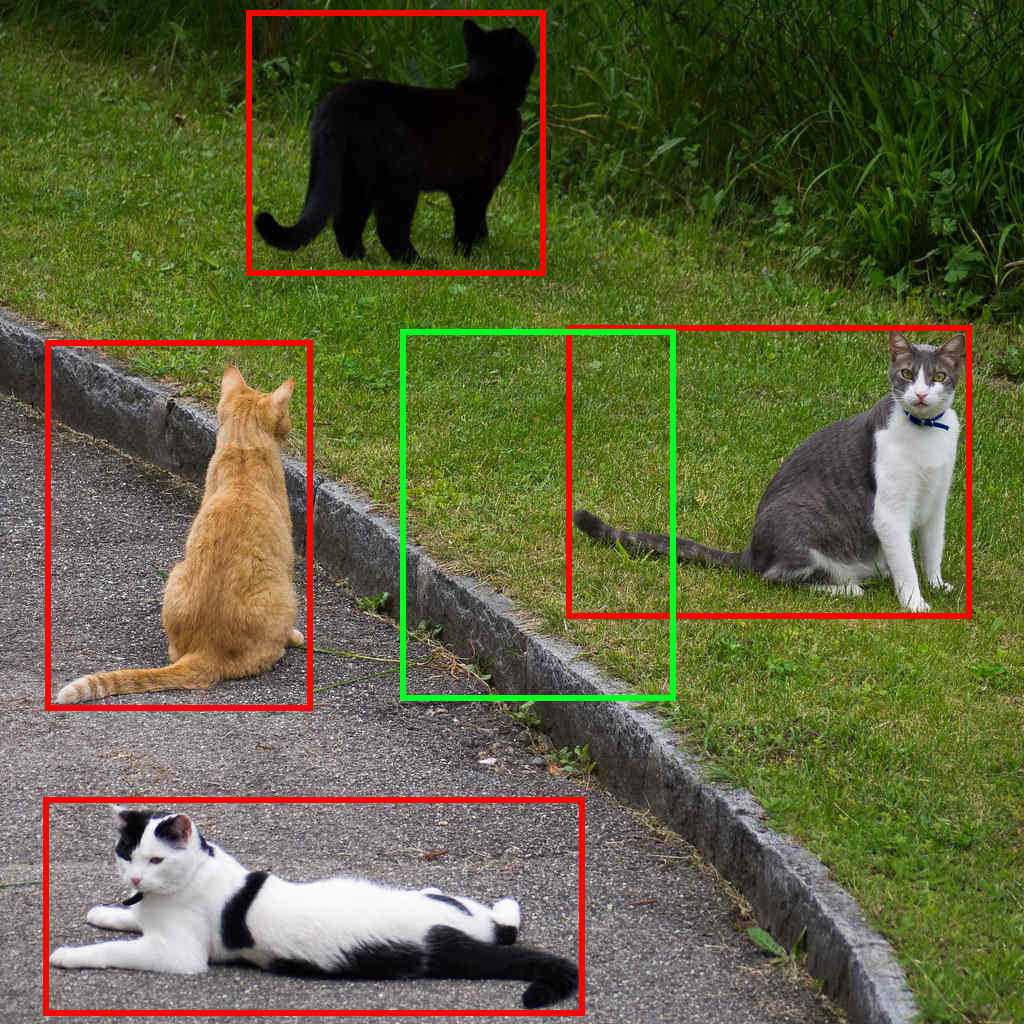
There are methods to limit the number of RoIs and maybe I’ll write about it in the future.
How to get RoIs from the feature map?
Now when we know what RoI is we have to be able to map them onto VGG16’s output feature map.
Every RoI has it’s original coordinates and size. From now we’re going to focus only on one of them:
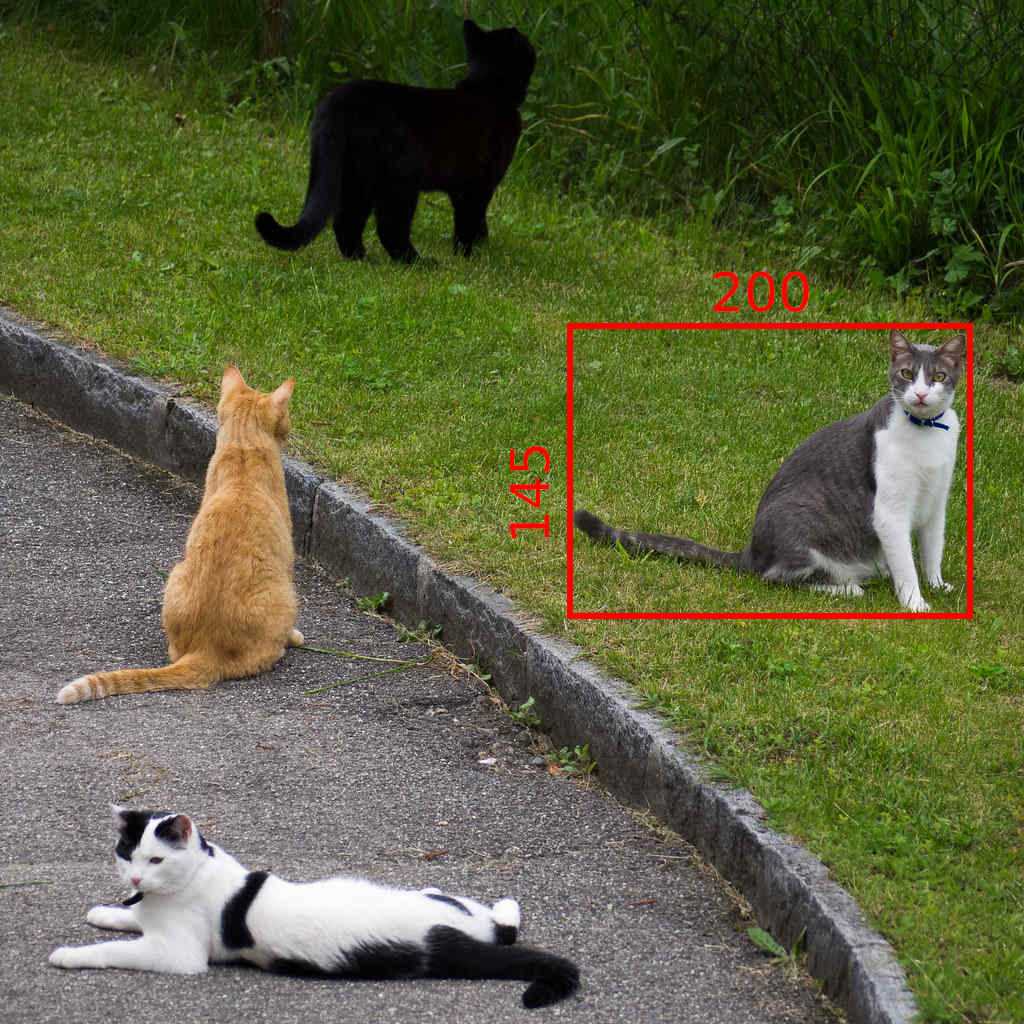
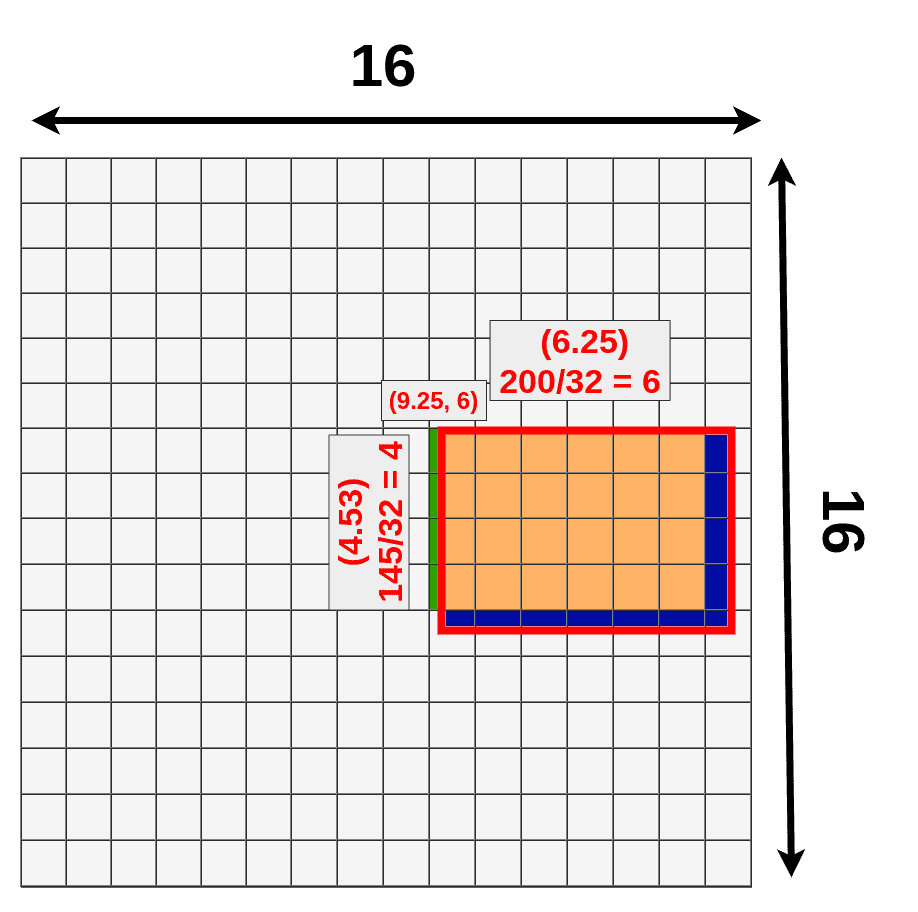
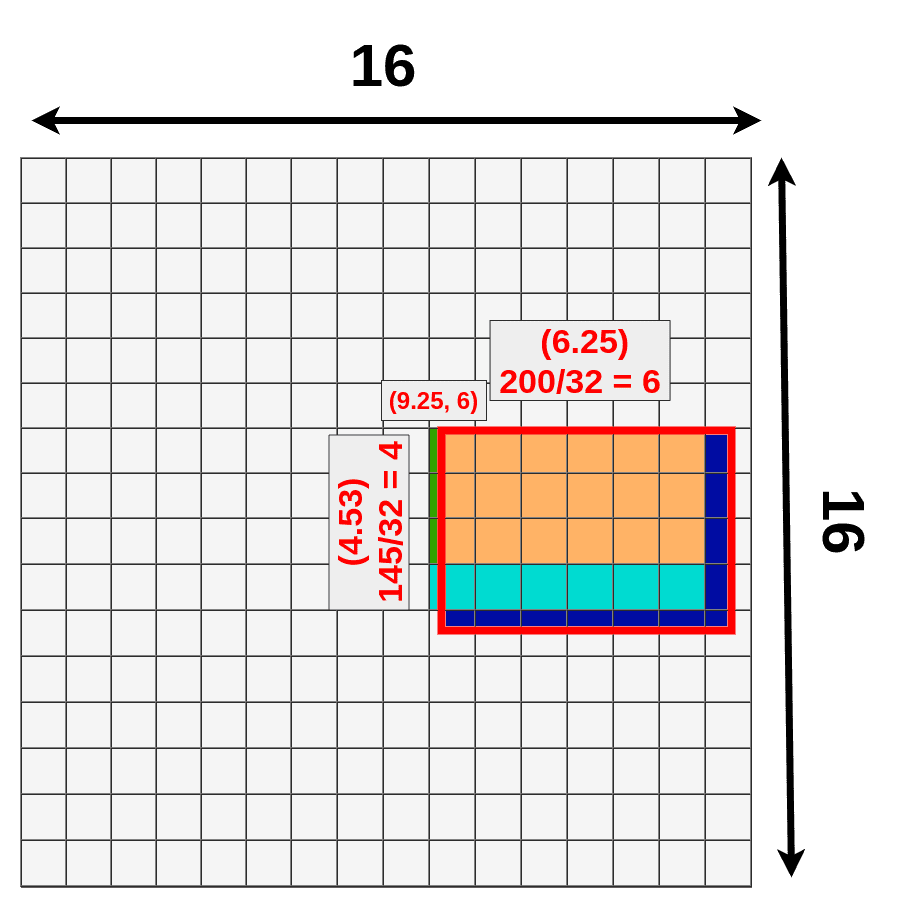
Its original size is 145x200 and the top left corner is set to be in (192x296). As you could probably tell, we’re not able to divide most of those numbers by 32.
- width: 200/32 = 6.25
- height: 145/32 = ~4.53
- x: 296/32 = 9.25
- y: 192/32 = 6
Only the last number (Y coordinate of the top left corner) makes sense. That’s because we’re working on a 16x16 grid right now and only numbers we care about are integers (to be more precise: Natural Numbers).
Quantization of coordinates on the feature map
Quantization is a process of constraining an input from a large set of values (like real numbers) to a discrete set (like integers)
If we put our original RoI on feature map it would look like this:
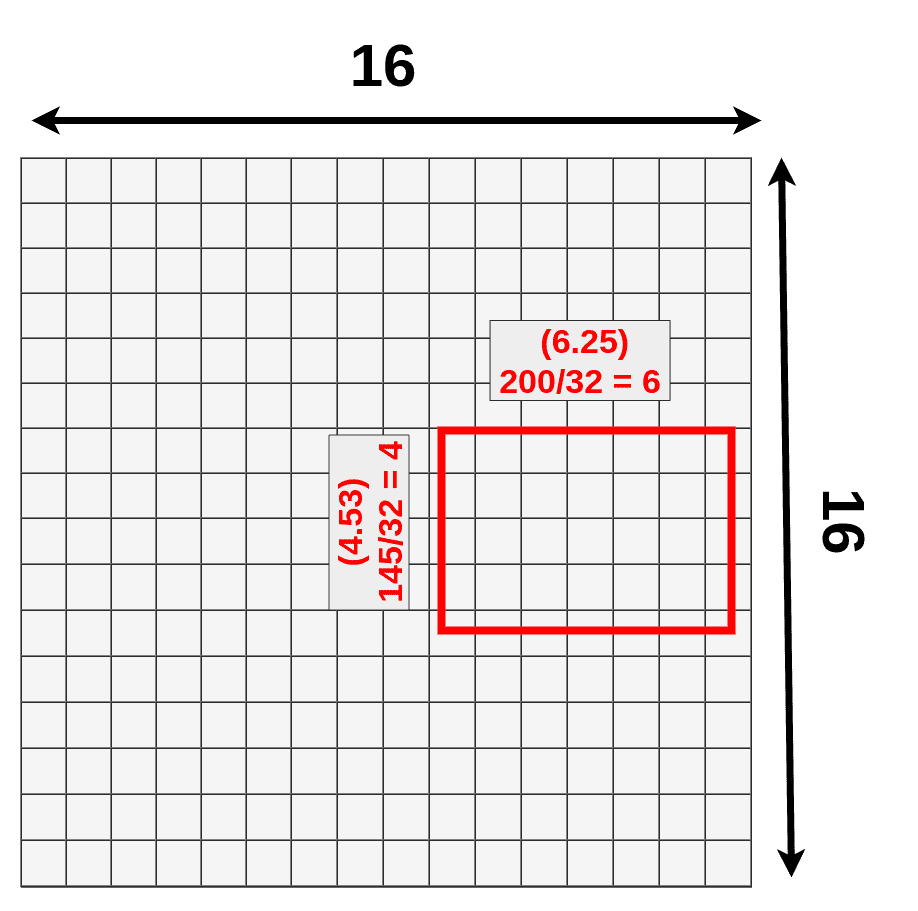
We cannot really apply the pooling layer on it because some of the “cells” are divided. What quantization is doing is that every result is rounded down before placing it on the matrix. 9.25 becomes 9, 4.53 becomes 4, etc.
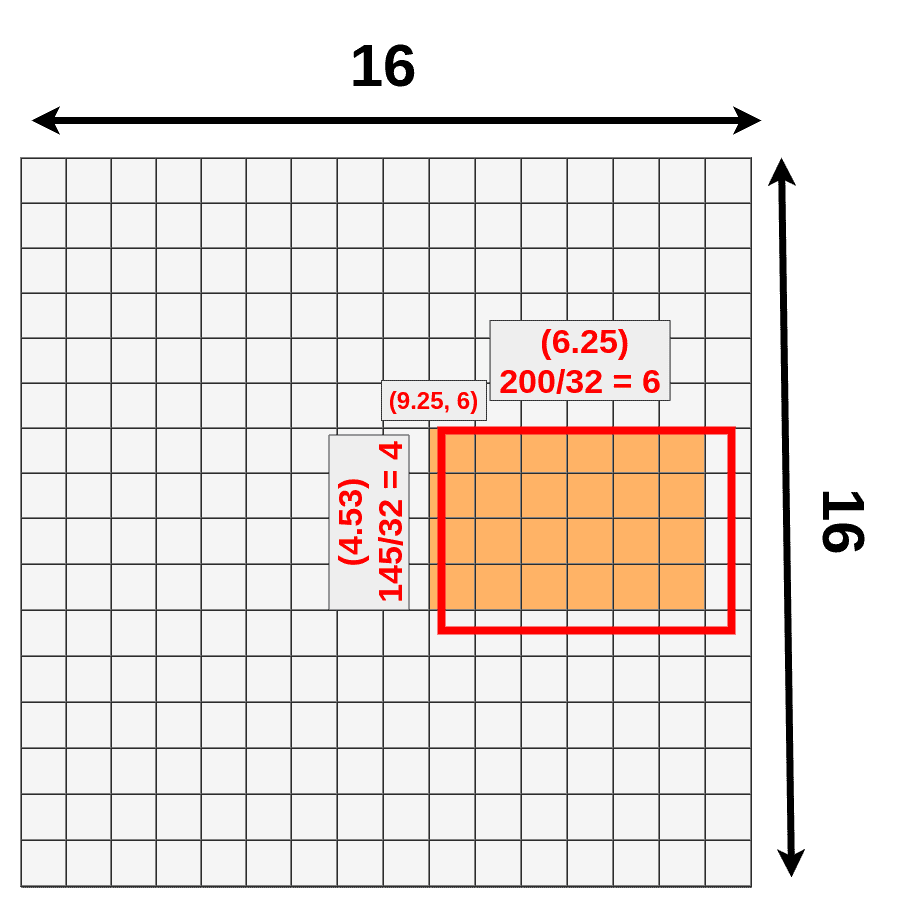
You can notice that we’ve just lost a bunch of data (dark blue) and gain new data (green):
We don’t have to deal with it because it’s still going to work but there is a different version of this process called RoIAlign which fixes that.
RoI Pooling
Now when we have our RoI mapped onto feature map we can apply pooling on it. Once again we’re going to choose the size of RoI Pooling layer just for our convenience, but remember the size might be different. You might ask “Why do we even apply RoI Pooling?” and that’s a good question. If you look at the original design of Fast R-CNN:

After RoI Pooling Layer there is a Fully Connected layer with a fixed size. Because our RoIs have different sizes we have to pool them into the same size (3x3x512 in our example). At this moment our mapped RoI is a size of 4x6x512 and as you can imagine we cannot divide 4 by 3 :(. That’s where quantization strikes again.
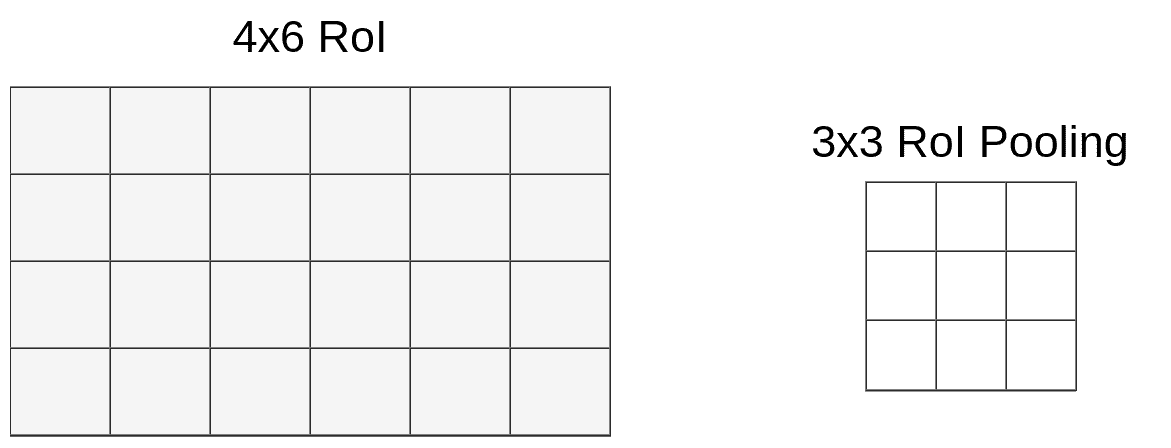
This time we don’t have to deal with coordinates, only with size. We’re lucky (or just convenient size of pooling layer) that 6 could be divided by 3 and it gives 2, but when you divide 4 by 3 we’re left with 1.33. After applying the same method (round down) we have a 1x2 vector. Our mapping looks like this:
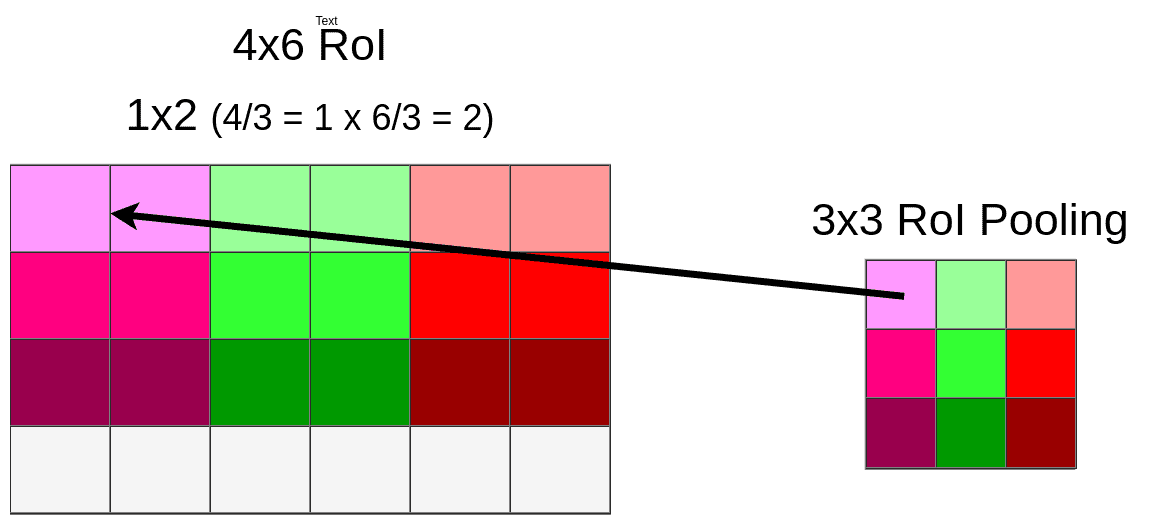
Because of quantization, we’re losing whole bottom row once again:
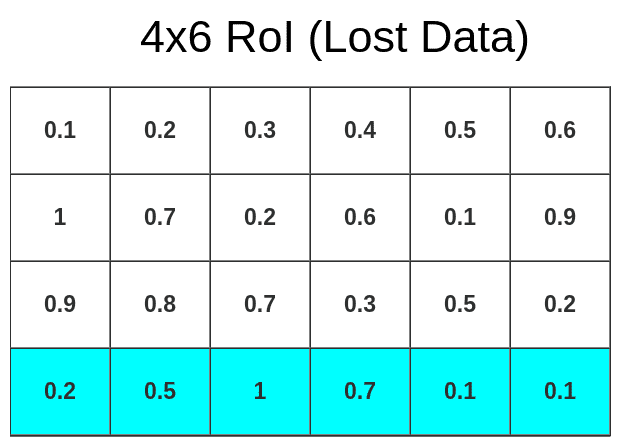
Now we can pool data into 3x3x512 matrix
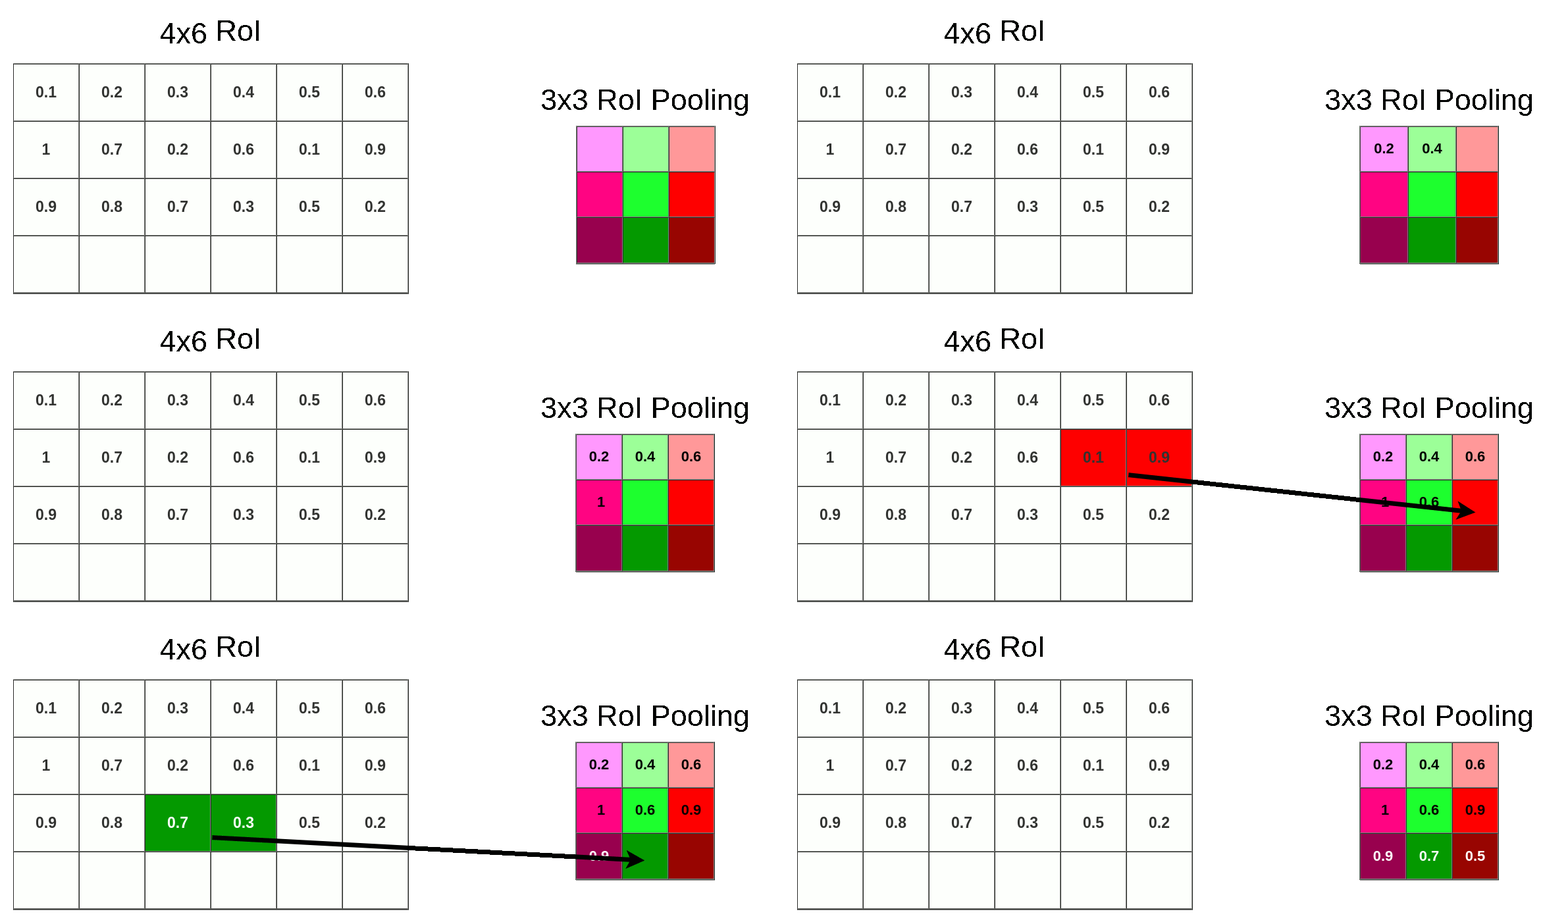
In this case, we’ve applied Max Pooling but it might be different in your model. Ofc. this process is done on the whole RoI matrix not only on the topmost layer. So the end result looks like this:
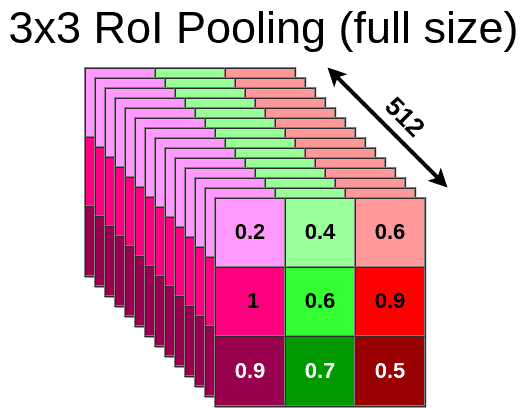
The same process is applied to every single RoI from our original image so in the end, we might have hundreds or even thousands of 3x3x512 matrixes. Every one of those matrixes has to be sent through the rest of the network (starting from the FC layer). For each of them, the model is generating bbox and class separately.
What next?
After pooling is done, we’re certain that our input is a size of 3x3x512 so we can feed it into FC layers for further processing. There is one more thing to discuss. We’ve lost a lot of data due to the quantization process. To be precise, that much:
This might be a problem because each “cell” contains a huge amount of data (1x1x512 on feature map which loosely translates to 32x32x3 on an original image but please do not use that reference, because that’s not how convolutional layer works). There is a way to fix that (RoIAlign) and I’m going to write a second article about it soon.
Edit: Here is a second article about RoIAlign and RoIWarp https://erdem.pl/2020/02/understanding-region-of-interest-part-2-ro-i-align
References:
- Fast R-CNN https://arxiv.org/pdf/1504.08083.pdf